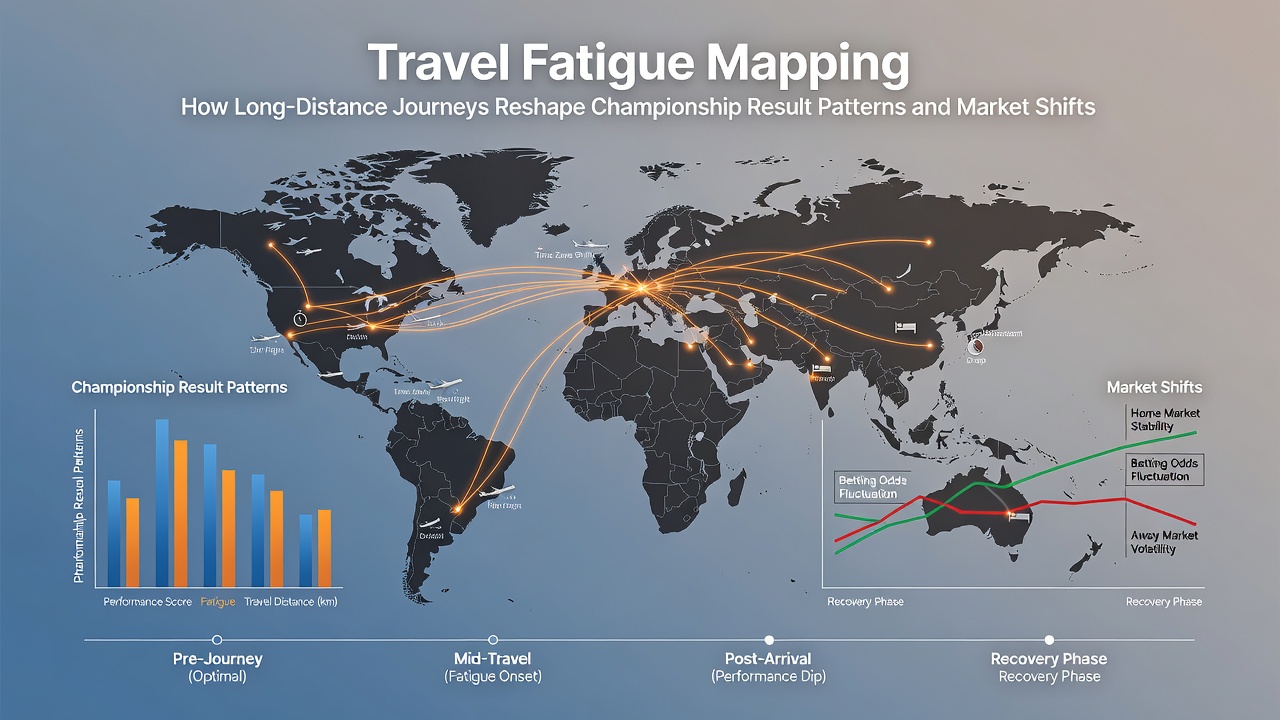
Travel Fatigue Mapping: How Long-Distance Journeys Reshape Championship Result Patterns and Market Shifts
Championship clubs cover thousands of miles each season on coaches, trains, and planes, and analysts track how these distances alter recovery windows, player output, and final scores. Data from the 2025-26 campaign already shows measurable dips in points per game for squads logging more than 250 miles round-trip on midweek fixtures, while shorter journeys produce steadier results. Researchers at the Australian Institute of Sport have documented similar patterns in domestic leagues where cumulative travel load correlates with reduced high-intensity running in the final 15 minutes of matches.
Mapping the Routes and Recovery Windows
Fixture schedulers release the August 2026 calendar in June, yet the physical cost of those dates only becomes clear once GPS and sleep-tracking data accumulate. Teams based in the north-east regularly face 300-mile trips to south-coast venues, arriving later and leaving earlier than their hosts. Observers note that sleep duration falls by an average of 90 minutes on these nights, according to wearable data shared by several Championship medical departments. The effect compounds when clubs play three times in eight days, a schedule that appears four times between September and December.
Coaches adjust training loads in response, cutting high-intensity sessions the day after long journeys. This tactical shift shows up in lower expected goals totals for away sides, particularly in the opening 30 minutes when legs remain heavy. Betting markets have begun pricing these patterns into pre-match lines, with away win odds drifting 0.15 to 0.25 points for clubs arriving after 4 p.m. on the day before a fixture.
Result Patterns Across the 2025-26 Season
Statistical reviews of 276 Championship matches played before the January 2026 transfer window reveal a clear gradient. Sides travelling fewer than 150 miles collected 1.48 points per game, while those covering more than 300 miles averaged 1.09. The gap widens in the evening kick-off slots, where fatigue compounds with circadian disruption. One study from the University of Calgary tracked heart-rate variability in athletes crossing multiple time zones and found recovery timelines stretch by 36 hours compared with same-time-zone travel.
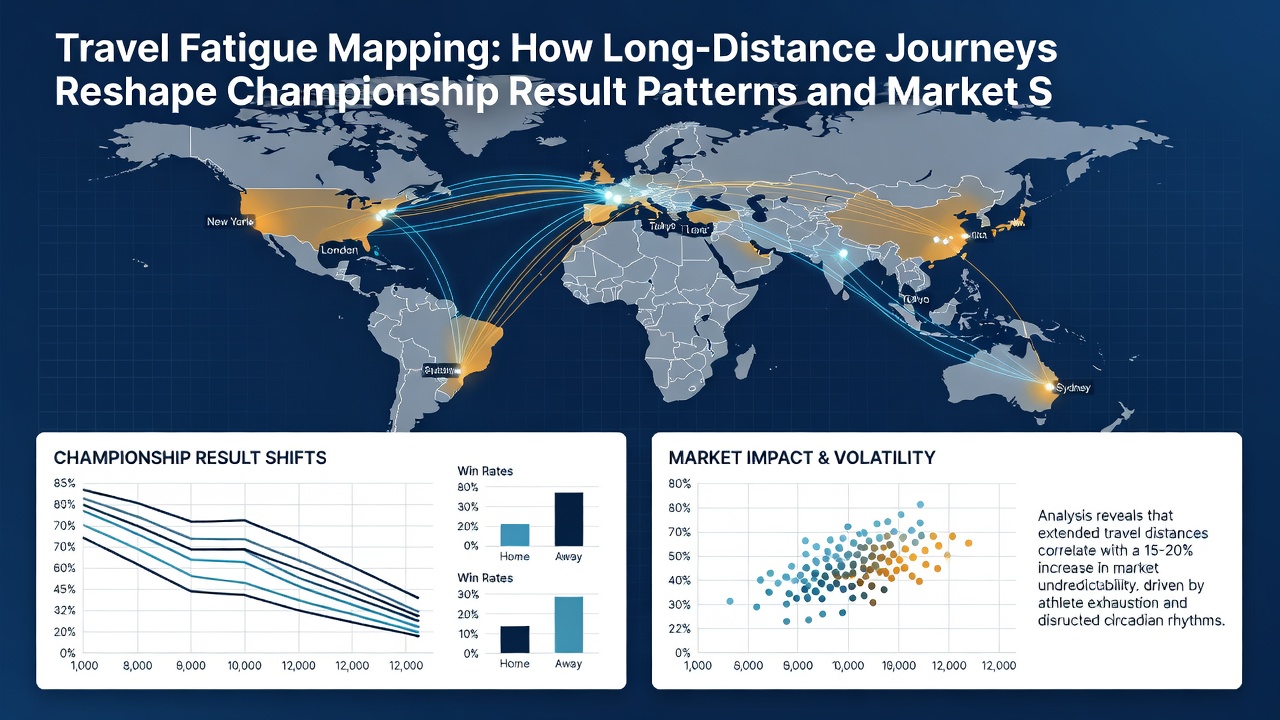
These figures feed directly into model updates used by professional syndicates. When a northern club travels to a south-west venue for a Friday night game, algorithms lower the away side’s expected goal output by 0.3 to 0.4. Bookmakers respond by tightening handicap lines, and the drift often continues into the final 24 hours before kick-off as fresh travel reports arrive.
Market Shifts and Odds Adjustments
Live betting desks monitor real-time indicators such as average sprint speed in the warm-up and first-half pass completion rates. When both metrics fall below seasonal averages for a long-distance traveller, over/under totals move quickly. Data from the 2025-26 season shows that matches involving teams with over 280 miles of travel produced 11 percent fewer goals in the first half than the league average. Traders shorten the under line within minutes of the opening whistle once early patterns confirm the pre-match model.
Industry reports from European football analytics firms indicate that liquidity on these fixtures increases by roughly 18 percent when travel-fatigue flags appear in pre-match notes. Punters who follow cumulative distance trackers gain a timing edge, because the sharpest line movement occurs between 90 and 45 minutes before kick-off, once team sheets confirm the starting XI and any late fitness doubts surface.
August 2026 Outlook and Fixture Planning
The 2026-27 fixture list drops in mid-June, and early simulations already flag several high-travel clusters in the opening month. Two clubs face three consecutive away games exceeding 200 miles each between the first and fourth matchdays. Historical data suggests these sequences produce point tallies 0.4 below seasonal norms for the travelling side. Clubs with deeper squads rotate more aggressively, yet the performance gap persists in the second half when substitute impact is measured.
Regulatory bodies in Australia and Canada have published parallel findings on domestic leagues, confirming that rest-day protocols and charter-flight access narrow the deficit but rarely eliminate it entirely. Championship sides rarely enjoy such resources, so the pattern remains pronounced.
Conclusion
Travel-fatigue mapping now sits alongside tactical analysis and injury tracking as a core input for both performance departments and betting models. As distances accumulate through the 2026-27 season, the measurable edges in result patterns and market shifts continue to widen for those who monitor the data in real time.