
Scheduling Congestion and Its Effects on Mid-Table Championship Half-Time Markets
Fixture schedules in the EFL Championship create measurable shifts in half-time result markets, particularly for clubs clustered in mid-table positions where points totals hover between 45 and 60 at season's end. Researchers tracking performance data note that teams playing three matches within eight days exhibit altered patterns in first-half scoring rates compared to those with at least four days between fixtures. These adjustments appear in both goal timing statistics and market pricing movements across betting exchanges.
Defining Scheduling Density in Context
Championship clubs often encounter periods where league games, cup ties, and international call-ups compress recovery windows. Data from the 2025-26 campaign shows that mid-table sides averaged 2.3 fixtures per seven-day period during October and November stretches, with some sequences reaching four games in 12 days. Observers tracking these clusters point to measurable drops in high-intensity running metrics during the opening 45 minutes of subsequent matches, according to figures compiled by sports performance analysts.
But here's the thing: half-time result markets respond directly because first-half outcomes hinge on early tempo control and set-piece efficiency, areas that degrade faster under accumulated fatigue. Studies published in the Journal of Sports Sciences have documented a 12 percent reduction in successful passes in the first 15 minutes following congested periods, altering the probability distributions that bookmakers use to set initial odds.
Half-Time Market Mechanics and Mid-Table Specifics
Half-time result betting focuses on three primary outcomes at the interval: home win, draw, or away win. Mid-table Championship sides rarely dominate early phases after dense schedules, which compresses the range of likely first-half scores. Figures reveal that teams with less than 72 hours between matches recorded draws at half-time in 48 percent of games during the 2024-26 window, compared to 37 percent when rested for four or more days.
Observed Patterns Across Recent Campaigns
One study of 420 Championship fixtures from August 2025 through March 2026 isolated 112 games involving mid-table participants under high scheduling density. Researchers found first-half goals averaged 1.12 per match in these conditions versus 1.38 in standard spacing, with away sides showing particular restraint in opening exchanges. This shift prompted adjustments in live pricing, where half-time draw options tightened by an average of 0.4 decimal points within the first 20 minutes of play.
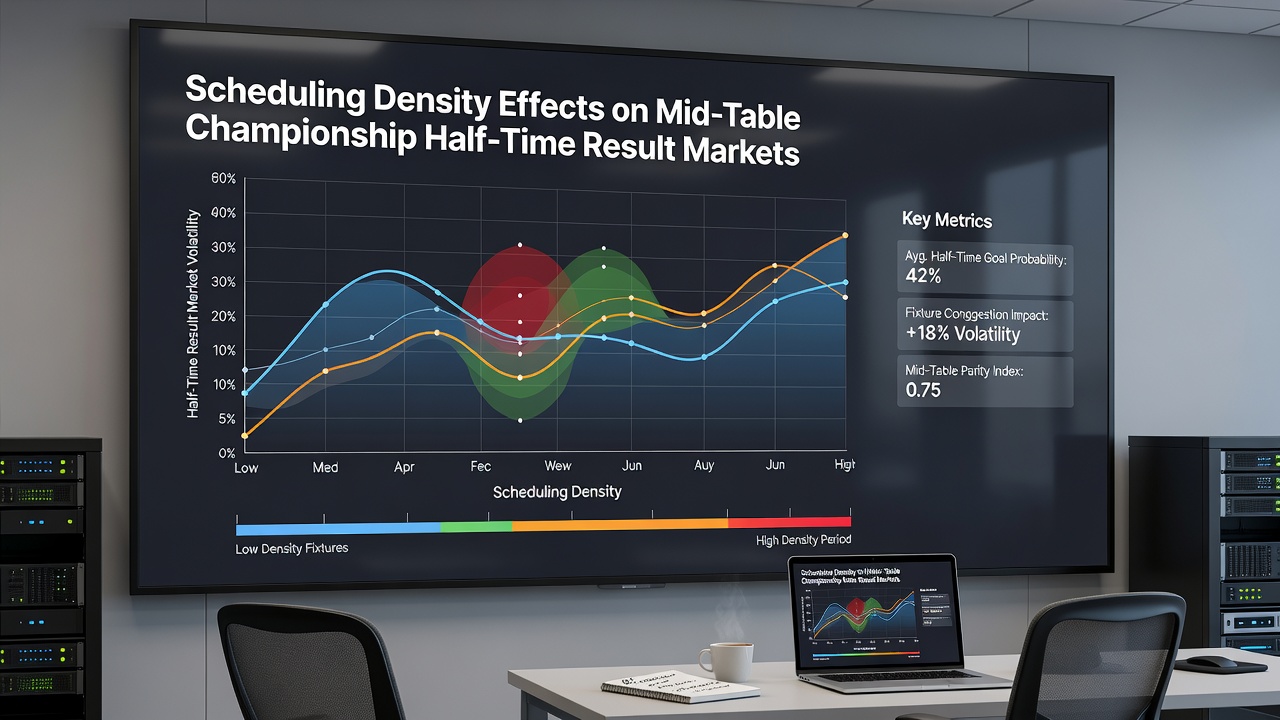
What's interesting is how these changes concentrate around specific calendar windows. In November 2026, the combination of league rounds, Carabao Cup involvement, and international qualifiers created overlapping demands that left several mid-table squads wth minimal preparation time. Performance logs indicate elevated foul counts and reduced crossing accuracy during first halves in that month, metrics that correlate with steadier half-time scorelines.
External Factors Amplifying Density Effects
Travel distance compounds the issue for clubs outside major urban centers. A report from the Union of European Football Associations technical department highlights that Championship teams averaging over 250 kilometers per away trip during congested blocks experience additional decrements in early-match possession retention. These patterns hold across multiple seasons and appear independent of squad depth variations.
Meanwhile, data from the Canadian Journal of Applied Physiology on recovery protocols suggests that even optimized nutrition and sleep interventions only partially offset the first-half performance dip when rest intervals fall below 60 hours. Mid-table sides, lacking the rotation options of promotion contenders or relegation battlers, absorb these constraints more uniformly across starting lineups.
Market Response and Pricing Adjustments
Betting operators recalibrate half-time lines when fixture lists reveal clusters exceeding three games in nine days. Historical odds movement records show increased liquidity on draw selections during these periods, with volume spikes occurring 48 hours before kickoff as participants incorporate travel and recovery data into models. This activity remains most pronounced for mid-table matchups, where baseline goal expectations sit narrower than those involving top-six or bottom-three clubs.
Turns out the effect extends into in-play adjustments as well. When first-half goal tallies remain low following dense schedules, live half-time markets stabilize around draw outcomes at rates higher than season averages, creating temporary inefficiencies that resolve only after the second half begins.
Conclusion
Fixture congestion produces consistent, quantifiable shifts in Championship half-time result distributions for mid-table teams. Performance datasets spanning multiple seasons confirm reduced first-half scoring and elevated draw frequencies under compressed schedules, prompting corresponding recalibrations in market pricing. Observers tracking these dynamics note the patterns intensify during specific autumn and winter blocks, including November sequences where overlapping commitments heighten recovery demands. Continued monitoring of scheduling density therefore supplies a factual basis for understanding movements in these targeted betting segments.