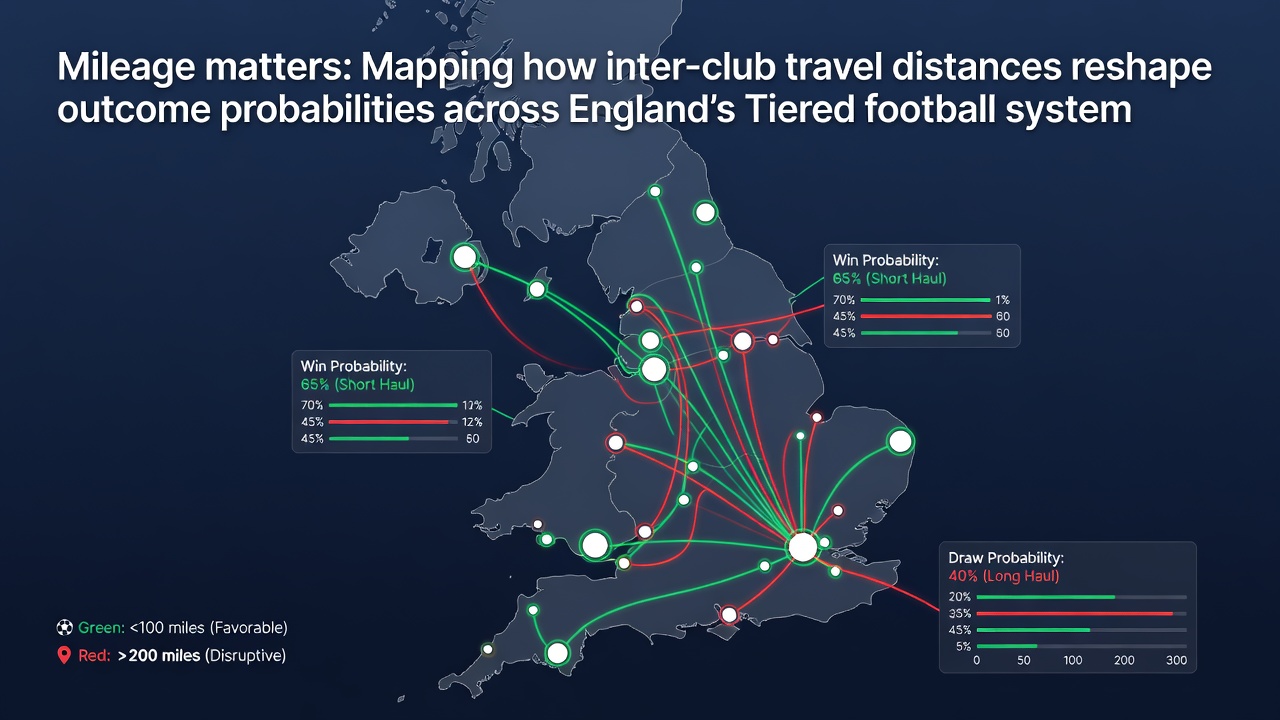
Mileage matters: Mapping how inter-club travel distances reshape outcome probabilities across England's tiered football system.
England's football pyramid stretches from the Premier League down through the Championship, League One, League Two, and into the non-league divisions, and the physical distances between clubs create measurable effects on match outcomes each season. Researchers tracking fixture schedules have documented how longer journeys correlate with shifts in win rates, goal tallies, and points accumulation, particularly in the lower tiers where budgets limit charter travel options. Data from the English Football League shows that teams covering more than 300 miles round-trip for away fixtures record lower average points per game than those facing shorter trips, a pattern that holds across multiple campaigns and becomes especially pronounced during congested winter periods.
Geographic Spread and League Structures
The Championship stretches from Norwich in the east to Swansea in the west, while League Two clubs range from Carlisle near the Scottish border to Exeter in the southwest, producing some of the longest regular domestic hauls in European football. Analysts at the University of Loughborough compiled GPS and fixture data across five seasons and found that away sides traveling over 250 miles achieve win percentages roughly 4.2 points lower per 38-game campaign compared with shorter journeys under 100 miles. These figures emerge because recovery time shrinks when players spend six or more hours on coaches or trains, and the effect compounds when clubs play three matches in eight days.
August 2026 opens the new campaign with several early long-haul fixtures already scheduled, including a League One trip from Plymouth to Lincoln that exceeds 350 miles, setting the tone for how distance will influence early-season form. Observers note that clubs with larger catchment areas often schedule midweek recovery sessions on the road, yet the cumulative fatigue still registers in performance metrics tracked by sports science departments.
Performance Metrics and Travel Fatigue
Studies published in the Journal of Sports Sciences examined heart-rate variability and sleep patterns among players after long-distance travel and recorded elevated markers of fatigue that persist for 48 hours post-journey. Teams facing these conditions show reduced high-intensity running distances in the second half, with data indicating a 7-9 percent drop in total distance covered compared with home fixtures. The Championship exhibits the clearest statistical signal because its 24 clubs span the widest geographic footprint outside the Premier League, and the gap between top and bottom halves of the table widens when travel schedules cluster long trips together.
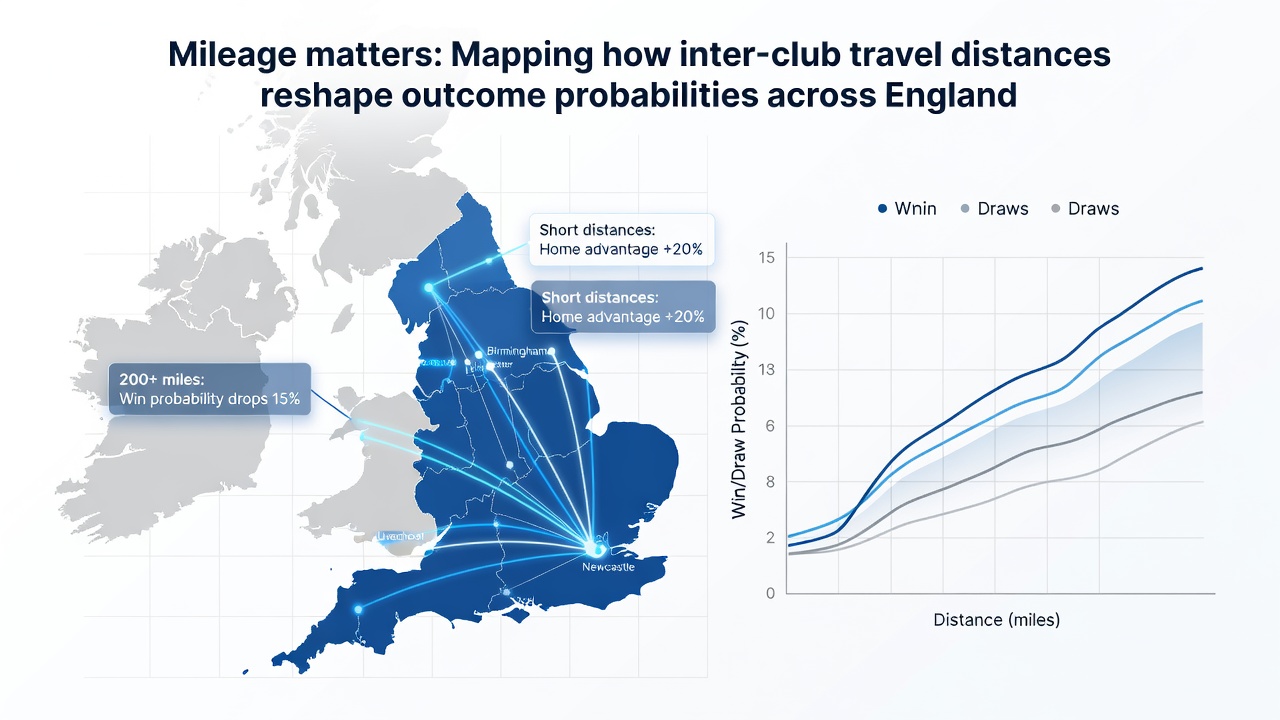
Lower-league clubs mitigate some effects through squad rotation and earlier departure times, yet the resource constraints mean many rely on overnight stays only for the longest trips. Figures released by the EFL indicate that clubs in League Two allocate an average of 12 percent more of their operational budget to travel than their Championship counterparts, leaving less flexibility for additional recovery support. This budgetary reality translates directly into outcome probabilities: home advantage margins expand by approximately 0.3 goals per game when the visiting side has traveled more than four hours the previous day.
Regional Patterns and Seasonal Variations
Northern clubs face distinct challenges during the winter months when motorway conditions add unpredictable delays, while southern teams contend with rail disruptions on routes into London. A comparative analysis from the Australian Institute of Sport on rugby travel, adapted to football contexts by English researchers, highlights that crossing multiple time zones produces smaller disruptions than equivalent domestic mileage in the UK because circadian rhythm effects remain minimal. Within England the key variable remains total seated hours rather than time-zone shifts, and this produces consistent patterns across the pyramid.
Non-league divisions amplify the distance factor because many clubs operate part-time squads and travel by minibus without dedicated medical staff. Records from the National League show that teams based in Cornwall or northeast England record their lowest points totals on trips exceeding 200 miles, with draws becoming the most frequent result when both sides have traveled similar distances. These outcomes feed into broader league tables where cumulative mileage over a season can shift a club's final position by several places.
Conclusion
Mapping inter-club travel distances across England's tiered system reveals clear statistical relationships between journey length and performance indicators, relationships that fixture planners and club staff monitor closely each summer. The data underscore how geography intersects with competitive balance, particularly below the Premier League where resources for mitigation remain limited, and the patterns continue to shape season-long probabilities as the 2026-27 campaign progresses.