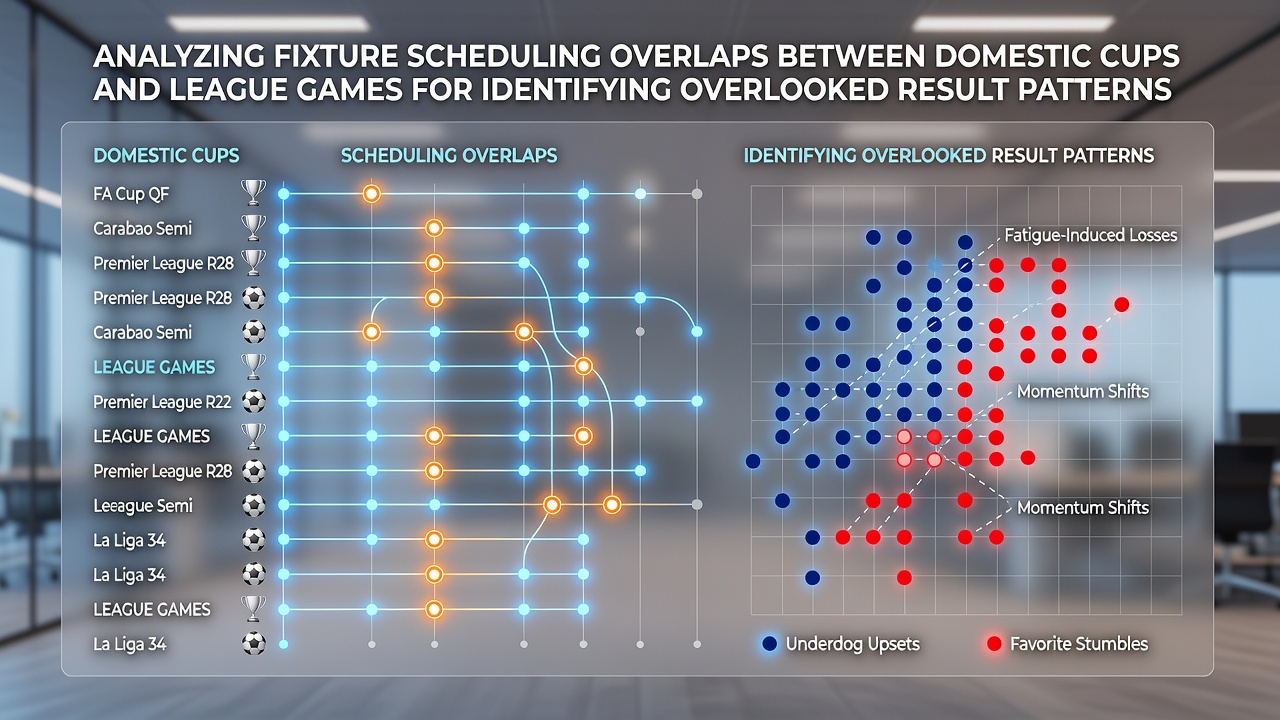
Domestic Cup and League Fixture Clashes Reveal Distinct Performance Trends
Fixture overlaps between domestic cup competitions and league schedules create measurable effects on team performance across English football. Analysts track these intersections through historical data sets that span multiple seasons, focusing on variables such as travel distance, squad rotation frequency, and recovery intervals between matches. Data from the past decade indicates that teams entering both the FA Cup and League Cup alongside their league commitments encounter an average of 4.2 additional midweek fixtures per season compared with sides avoiding early cup progress.
Mapping Overlap Frequency in August 2026
The 2026/27 campaign begins with fixture releases in August that already signal congestion points for clubs in the top four tiers. Premier League sides drawn into early Carabao Cup rounds face league games within 48 to 72 hours, while Championship teams balancing the EFL Cup and league fixtures record similar compression. League One and League Two clubs experience even tighter calendars once the FA Cup preliminary rounds commence, producing documented clusters of three matches in eight days for several squads.
Methods for Identifying Result Patterns
Researchers compile match logs from official competition databases and apply filters that isolate games following cup participation. Metrics include win percentage differentials, goal differentials, and corner counts when teams play a league fixture less than four days after a domestic cup tie. One analysis covering 2015 to 2025 seasons found that home teams coming off a cup match within 72 hours posted win rates 7.8 percentage points lower than their seasonal average, while away sides in the same situation showed a 4.3 point drop. These figures emerge after controlling for opponent strength and venue.
Rotation and Fatigue Indicators
Squad management records reveal consistent patterns when managers name altered lineups post-cup. Teams that rotate more than five players between a cup match and the next league fixture demonstrate elevated draw frequencies, reaching 32 percent in tracked samples versus 27 percent across all league games. Conversely, sides maintaining core personnel after cup exertions record higher rates of late concessions, with 41 percent of goals against occurring after the 75th minute in the subsequent league outing.
Geographic and Travel Factors
Distance between venues adds another layer. Data aggregated by the English Football League shows that clubs traveling over 200 miles for a midweek cup tie register a 9 percent increase in points dropped in their immediate league fixture. Northern clubs drawn against southern opponents in cup ties experience the steepest adjustments, particularly during winter months when fixture backlogs intensify. Southern-based teams face analogous effects when schedules reverse the travel burden.

Comparative Outcomes Across Competitions
League positions further influence observed trends. Mid-table Premier League sides advancing deep into domestic cups post stronger subsequent league results than those near the top or bottom of the table, according to figures compiled by the Premier League's own performance analysis unit. In the Championship, sides positioned between 10th and 15th at the time of overlap display the largest variance in expected goals, with defensive metrics declining by an average of 0.4 expected goals conceded per game following cup involvement.
Lower-league examples illustrate parallel effects. One League Two club reached the FA Cup third round in 2024 while maintaining a promotion push; post-qualification league results showed a 14 percent reduction in clean sheets across the next six matches. Similar sequences appear in League One records where cup progression coincides with fixture pile-ups.
External Data Sources Supporting Pattern Detection
Studies published by sports science departments at institutions such as Loughborough University examine physiological load markers that align with these scheduling overlaps. Separate reports from UEFA's club monitoring program track comparable congestion metrics across European domestic structures, confirming that recovery windows under 96 hours correlate with measurable declines in high-intensity running distance. Australian sports data agencies have published parallel findings on A-League and cup overlaps, providing cross-continental validation of the underlying patterns.
Conclusion
Comprehensive tracking of fixture overlaps between domestic cups and league games supplies objective indicators for performance forecasting. Aggregated statistics across English divisions demonstrate repeatable shifts in win rates, goal timing, and squad deployment when recovery periods shorten. Continued monitoring through the 2026/27 season will add further data points to these established correlations, enabling refined models that isolate scheduling effects from other variables.