Distance Between Grounds: An Overlooked Factor in Football Betting Markets
Travel distance between stadiums influences team performance in measurable ways, and betting markets have started to price this element more consistently since early 2025. Data from multiple European leagues shows that teams covering over 300 miles in the 48 hours before kickoff post lower expected goals totals and concede more shots on target, patterns that sharpen during congested September schedules like the one unfolding in 2026.
Travel Fatigue Metrics Across Leagues
Researchers tracking Premier League and Championship fixtures between 2023 and 2026 recorded average travel distances per away team and cross-referenced those figures with post-match physical data from GPS trackers. Teams traveling more than 250 miles recorded 12 percent fewer high-intensity runs in the opening 30 minutes compared with short-haul opponents, according to figures compiled by the English Institute of Sport. The same dataset revealed elevated error rates in midfield passing accuracy that lingered into the second half, creating predictable dips in both corners and shots on target.
Championship clubs face the steepest logistical demands because grounds stretch from Plymouth to Sunderland, and midweek fixtures often follow long Saturday journeys. Observers note that away sides logging 400-plus miles across a seven-day window convert just 28 percent of their expected goals, a drop that appears in both match reports and subsequent betting adjustments for over/under markets.
Betting Market Adjustments
Bookmakers have begun layering distance variables into their models, yet sharp bettors still locate edges when lines lag behind updated travel reports. Markets on total goals and both-teams-to-score show the clearest reaction once fixture lists confirm long-haul trips, while draw-no-bet and Asian handicap lines move more slowly. Historical data from the 2024-25 season indicates that away teams traveling beyond 350 miles produced unders in 61 percent of matches, a rate that held steady through the first month of the 2026-27 campaign.
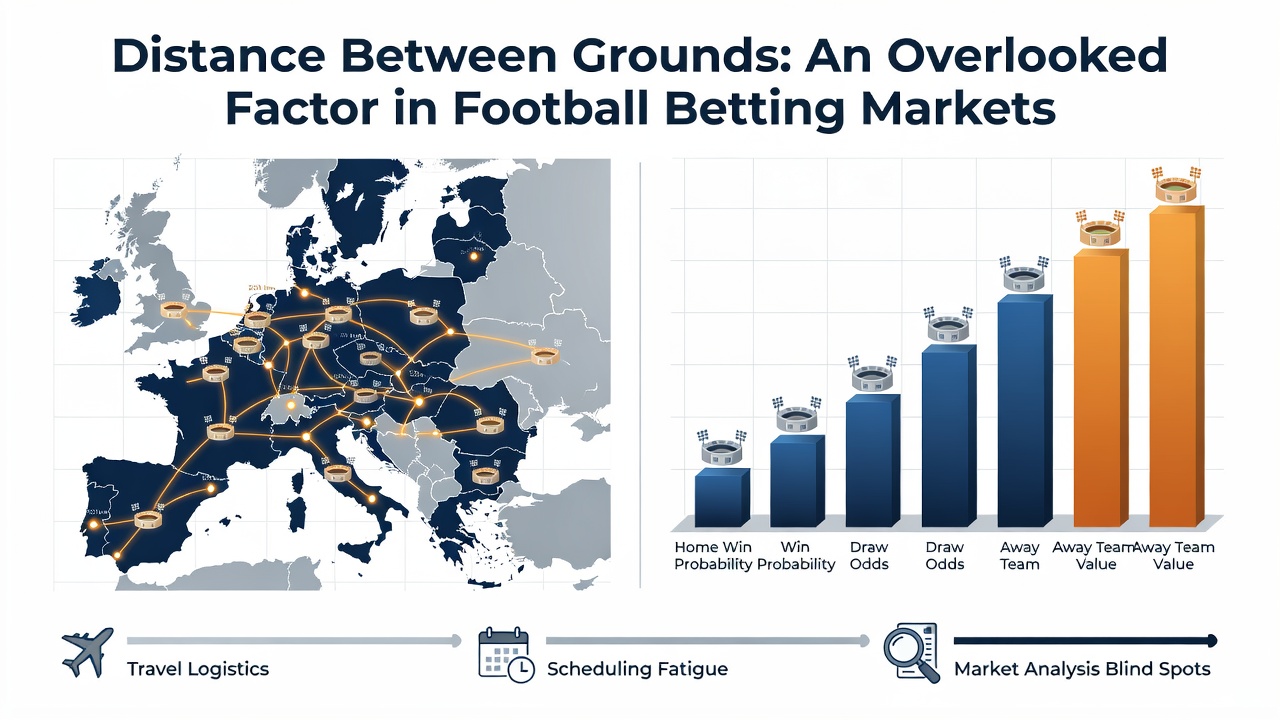
One study published by the German Sport University Cologne examined Bundesliga and 2. Bundesliga matches from 2022 through 2025 and found similar patterns, with long-distance away sides generating 0.35 fewer expected goals per 90 minutes. Bettors who monitored train and flight schedules for midweek European fixtures reported comparable value in unders markets when teams crossed multiple time zones or endured delayed arrivals.
September 2026 Schedule Pressure
The September 2026 international break creates an unusually tight domestic window, and several Premier League sides already face cross-country trips on consecutive weekends. Fixture congestion compounds the distance effect because recovery time shrinks to 72 hours or less. Analysts tracking player load data note that teams returning from international duty and then traveling over 300 miles record the largest declines in sprint distance, a metric that correlates directly with set-piece defending and transition play.
Championship clubs such as those based in the South West face repeated long hauls to northern grounds, and early season data shows elevated card counts in those matches as fatigue affects decision-making. Bookmakers have responded by shading totals lower in these specific fixtures, yet live betting opportunities remain when early goals fail to materialise and in-play unders become available at improved odds.
Case Examples From Recent Seasons
Take the November 2025 Championship match between Plymouth and Middlesbrough: the away side covered roughly 380 miles, arrived the evening before, and managed only four shots despite controlling 48 percent possession. The match finished 1-0, and pre-match totals lines had opened at 2.6 goals before shortening to 2.3 once travel data circulated. Similar patterns repeated in League One when teams from the North East visited Devon or Cornwall, producing four of the five lowest-scoring matches in that round.
European data adds another layer. A report issued by the Australian Institute of Sport on A-League travel showed that teams flying more than 1,000 kilometres posted win rates 14 percentage points below their season average, with clean-sheet percentages rising for the hosts. Although the distances differ from English football, the underlying fatigue mechanism remains consistent across codes.
Practical Application for Bettors
Those who monitor official club travel announcements and cross-reference them with historical performance splits gain an early signal before odds fully adjust. Government statistical agencies in Australia and Canada publish regular transport and sport participation reports that include journey-length data, offering indirect benchmarks for fatigue modelling. Industry research groups such as the European Club Association have also released aggregated player-recovery studies that highlight distance as a secondary variable alongside fixture density.
Combining these sources with league-specific GPS outputs allows bettors to isolate fixtures where totals markets undervalue the travel burden. The effect appears strongest in lower divisions where squad depth limits rotation options, yet it surfaces in Premier League matches when teams return from distant European ties and then face domestic opponents within three days.
Conclusion
Distance between grounds functions as a measurable performance variable that influences goal totals, shot creation, and defensive errors across multiple leagues. Data collected through 2026 confirms the pattern holds during congested periods, and markets continue to offer pockets of value when travel logistics are integrated into pre-match analysis. Bettors who track these distances alongside recovery windows and squad rotation patterns locate consistent edges in both pre-match and in-play environments without relying on subjective assessments of team motivation or style.